Piktochart is a web App for creating infographics that are easy and enjoyable to use. The App has a graphic interface based on Drag&Drop, with which you can easily manage the elements. Piktochart allows you to create texts, import images or use the predefined ones, use vectorial elements and create graphics, and even import content directly from .CVS files (such as those of Microsoft Excel). Once you have created your infographic, you can decide whether to export it as an image or in HTML (only for pro clients) which can be read by search engines, or to share it on Facebook, Twitter, Pinterest and Google+. How do you use it? To use Piktochart, you must first create an account: once you are connected to www.piktochart.com, click on the orange button “Try Piktochart for FREE”. You will be sent to a page where you will be asked to register. If you are already registered on the site, you can enter your credentials and click on Sign In. To register as a new user, you must enter your details and click on “Create an account”. After having entered the site (in the case of a new account, you will be connected automatically at the end of the registration procedure), you will find yourself on the page pictured below, where you can create a new infographic by clicking on “Pick Theme” (No. 1). You can choose from around a hundred themes, or many more if you register as a Premium user (a fee applies). Moreover, by clicking on “My Saved Piktocharts”, you can access the infographics you have saved previously. 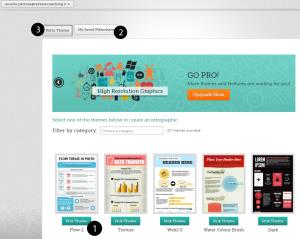 Once you have entered the heart of Piktochart, you will find yourself on the page for creating and modifying your infographics with the various commands described below. At the top there is a drop-down menu that allows you to save your infographics, export them and see a preview (No. 3). At the top right (No. 4) there are some arrows that can be used to cancel or restore your last operations (if you have made some errors) and to set the zoom. The central area (No. 2) allows you to add blocks to your infographic, and to duplicate or eliminate them. Moreover, you can decide the width in pixels of your infographic.
 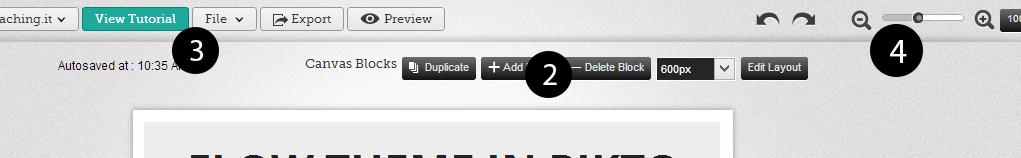 At the bottom of the page, you can find the resources that are available with Piktochart. There is an index (No. 1) that allows you to filter various content (images, graphics, backgrounds, uploads).
 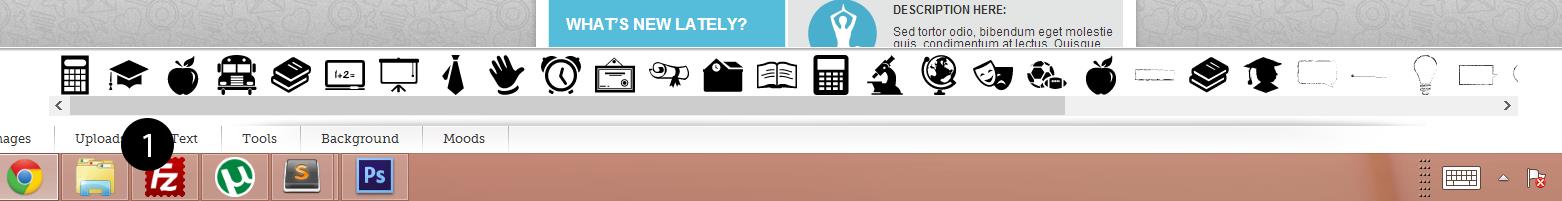 To insert an element, as already mentioned, you choose it and drag it within your image. (Drag & Drop). To modify it, you must select it and you will see a new bar open at the bottom of the screen which will allow you to copy/paste (No. 1), rotate (No. 2), and choose (if there are two elements that are overlapping) whether to place the element under or above the others, its colour and opacity and, for text, the font and its size. You can also modify the size of images and icons (vectorial images) by dragging their corners.
 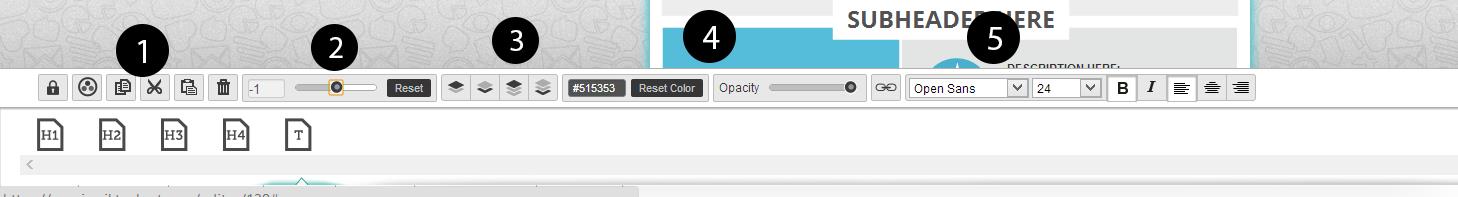 By clicking on “Edit Layout” at the top, you will be taken to the area for modifying the blocks. Using the buttons (No. 4) you can move the blocks higher or lower. To increase the height of a block you must use the mouse: if you move the cursor to a corner, you will see that it changes. Hold down the left mouse button and drag.
 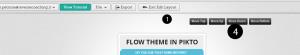 Once you have finished modifying, click on “Exit Edit Layout” (No. 1) to return to the editor. To export your work, after having clicked on “Exit Edit Layout” at the top, you will have to use a new window. By clicking on “Publish to Html” (No. 5), the link and the code to incorporate on your site will appear next to a single initial tab (No. 1).
  To export the image in .png or .jpg, click on the relative buttons (No. 4). A preview of the image will appear on the right that you can save by clicking with the right button and, after another menu appears, on save image.
 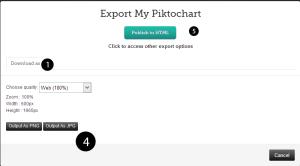 All the data for your infographic will be saved on Piktochart’s secure servers, guaranteeing privacy for your files. Lastly, should you have any problems, the customer service team is available 5 days a week and you can also contact them either via e-mail, on Twitter @Piktochart orlive on the web site. Aurelio Petrone
insights